In February of this year, a blog post by the OWASP ZAP newsletter has pointed us towards an interesting technology called Chrome Logger. Chrome Logger can be used to display server side debugging information into the web console (e.g. in Firefox) at runtime.
How it works
First, download and import the server side library which is available for different languages like Python, PHP or Java (see https://craig.is/writing/chrome-logger). In the sample below, you can find the PHP server lib include from http://github.com/ccampbell/chromephp in line 2.
<?php
include 'ChromePhp.php';
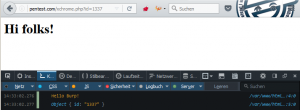
ChromePhp::log('Hello Burp!');
ChromePhp::log(json_decode($_GET));
?>
<h1>Hi folks!</h1>
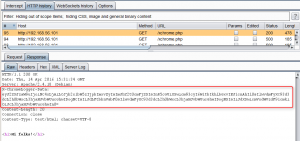
The code snippet adds a new HTTP Response Header called X-ChromeLogger-Data (see figure below) which transfers the input of the ChromePhp::log method in base64 encoded form. Thus, it is possible to debug server variables or data flow controls at runtime in a fast way. In addition, Firefox provides native support of Chrome Logger since version 43.
Why is this useful?
The Chome Logger feature directly aimed towards developers but might also be interesting for security auditors who have access to the source code of the test object (e.g. WordPress Plugin or other open source projects). The output of the debugging information can improve the results by reviewing complex functions or validating rules in white box audit.
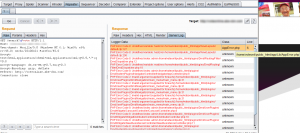
As web penetration testers, we are interested to view the decoded debug information in the HTTP message editor of the BurpSuite tool to combine the received data with other components like Burp Repeater or Intruder. As you can see below, the base64 decoded data is not really readable with larger debug output.
{"version":"4.1.0","columns":["log","backtrace","type"],"rows":[[["Hello Burp!"],"\/var\/www\/html\/xchrome.php : 4",""],[[{"id":"1337"}],"\/var\/www\/html\/xchrome.php : 5",""]],"request_uri":"\/xchrome.php?id=1337"}
That’s the reason to write a small Burp Plugin which performs the transformation of the received data and display the data in a human readable format. Now, the debugging information can be reviewed in the Repeater or Intruder tab. You can find the code on GitHub: https://github.com/no-sec/burputils-XChromeLogger-decoder
Keep in mind
As already mentioned in the ZAP blog post, please keep in mind that an active debug interface like Chrome Logger represents a security risk (Kingthorin calls it “XCOLD Information Leak“) and should be used only in test environments.
- BurpSuite – Update HTTP Header in Session Handling Rules - 18. September 2018
- DefCon 24 - 27. September 2016
- Using Chrome Logger in BurpSuite - 27. July 2016